When working on any kind of project, you have to express every step of the process visually. It is the best way to understand how everything works. In addition, this representation will enable you to notice any potential problems and resolve them before they occur, or on the other hand, think of a way to further develop each step.
This is why flowcharts are so widely used. A flowchart is basically a diagram that shows every aspect of a certain process and visually represents its development. Naturally, there are numerous types of these diagrams, so in the following text, we will introduce you to these and provide you with ideas on how to use them.
1. The process flowchart
Without a doubt, this type is most frequently used simply because it can be applied to any kind of project. It can be used to delegate responsibilities among participants in a certain organization or to map out the development of a project. This type of diagram is especially useful if each of those steps requires a certain set of changes or decisions.
2. The swimlane flowchart
This diagram is a bit more complicated than the previous one, but this one enables you to represent multiple sets of data side-by-side. For example, you may be working on a new project that includes several departments in your company. Since it enables you to create different categories, it will be easy to map out and include every step that will lead you to the ultimate goal. By using this type of diagram, businesses can easily express two simultaneous processes that include both internal and external departments and also show where the work of the two groups overlaps.
3. The workflow chart
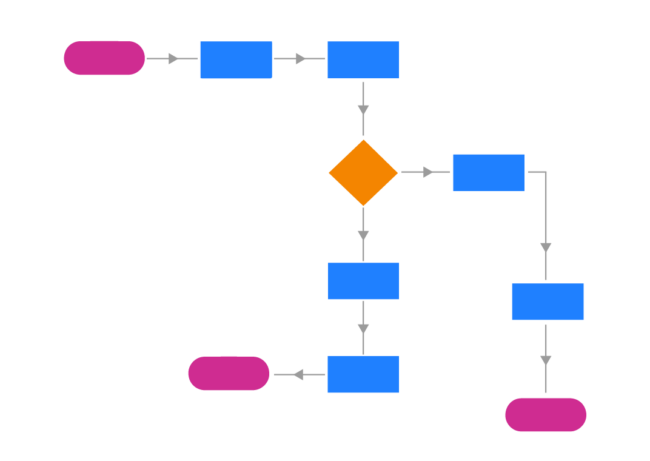
As you can assume by its name, the workflow diagram is most commonly used to express how a certain organization functions. Its main goal is to represent a basic set of procedures that occur on a daily basis, and at the same, investigate each part of the organization and locate a potential issue. Besides, it can also be used to introduce new employees or partners to the workflow of the company.
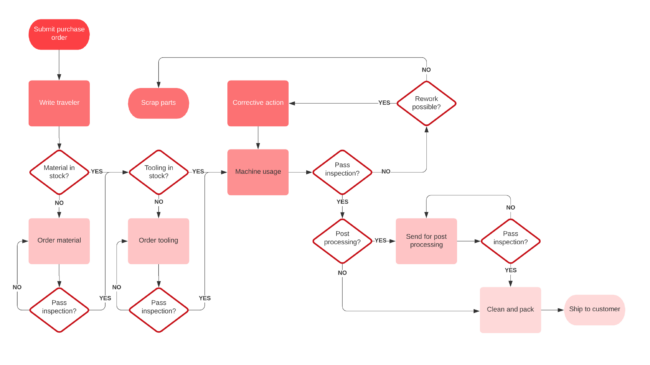
4. The decision flowchart
Every time, before you make a big decision that can have a significant effect on your company, you have to analyze all of its potential benefits and downsides carefully. This entire process is facilitated by this type of diagram. In a nutshell, it enables you to express every possible outcome visually. Then, you have a chance to go over each of these, understand potential consequences, and eventually, rest assured that you have made the best decision possible for your company.
5. The SDL flowchart
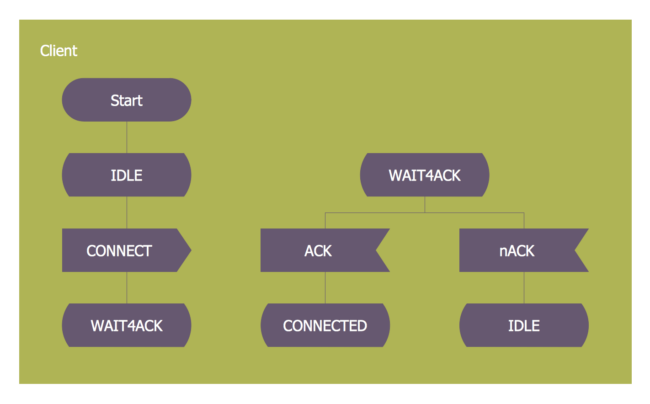
This diagram is specifically used for brainstorming ideas when working on new computer algorithms. Specification and Description language flowchart features a particular set of symbols, and its three main components are the system definition, the block, and the process. These are also often used to help customers solve issues with the system that frequently occur. Since every step is visually express, this diagram can greatly help one has to troubleshoot common problems.
6. The data flowchart
Simply put, this diagram enables you to express how data is processed within a system. It is most commonly used in software development and design, but its beauty is that it can be used for numerous purposes. You can analyze how information moves through different systems in your company over a certain period of time. By using specific symbols, you can easily display a large amount of information.
How to draw the flowchart?

Now that we have told you about a few types of diagrams, let us give you some tips on how to create and draw one. First things first, nowadays, there are many programs that will enable you to do this without any trouble. As you can assume, each of these has a specific set of features, and you can learn about some of them on www.zenflowchart.com.
Next, you have to decide which type of flowchart you should use. We have already discussed the features of these and provided you with examples of when each of them should be used. If you still aren’t sure which one is right for you, conduct quick research and acquire more information.
Even though it may sound odd, you should start your flowchart by inputting the start and end point, that is, your main goal. Then, you can break it down into more steps. It will be easier for you to understand what you have to do to reach the finish line.
Finally, if you are working on a complex diagram, it is a good idea to color-code it. You can highlight parts of different processes, the main points, the ones that can affect the outcome, those that may pose a risk to your business, important decisions that have to be made, etc.
What are the most common mistakes?
Finally, we will discuss some frequent mistakes people make when drawing a diagram. Most of these are unintentional, and you may not even realize them, but they can have a serious effect. First of all, there is a matter of symbols. Surely, you are familiar with at least some of these, and if you are on a schedule, you may choose to use the same one over and over to save some time. If you are drawing a chart just for yourself, this may be okay, but if you have to send it to employees or associates, they might not be able to understand the diagram, so they may have a million questions for you, or they may proceed and end up making mistakes.
Next on, we have already mentioned that color-coding is a great feature that can make your diagram easier to read and understand. Having this in mind, you also have to make sure not to go overboard with the shades. The whole point of it is to represent an idea or a process in a simple manner, and you won’t achieve this if you include too many colors.
Lastly, if necessary, you should include additional descriptions at the bottom of the document. Once again, just because you understand every part, it doesn’t necessarily mean that others will too.